
Insurance Portfolio Review Prioritisation
Problem
How would you prioritise 1.05M insurance policies when review effort is being spread evenly, regardless of where claims are actually concentrated?
What I Built
A modular, rerunnable SQL workflow using baseline benchmarking, lift scoring, Pareto analysis, tenure cohorts, decile analysis, and stability checks to systematically identify where claim concentration existed.
Outcome
The top 30% of policies generated 55% of total claims, with the top two deciles accounting for 45%. Policy type, location, and tenure showed no meaningful concentration, indicating segment and lifecycle factors were not primary drivers. An interactive dashboard and model performance evaluation assessed potential revenue and customer loyalty risk, creating a repeatable framework for targeted portfolio review.
Operational Price Review Support
Problem
How would you know whether a used vehicle's asking or offer price is fair, and what should you do if the market data suggests it isn't?
What I Built
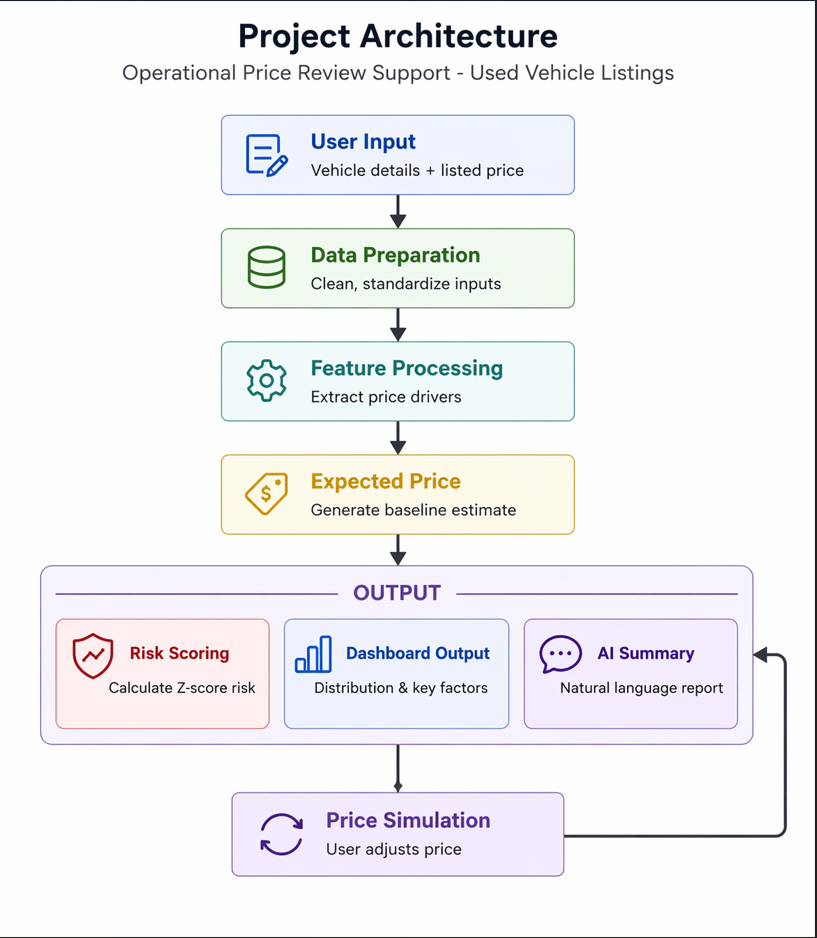
A model-driven pricing decision support system that estimates an expected market price, benchmarks a proposed price using Z-score analysis to classify pricing risk, and provides plain-language guidance on whether the price is reasonable, overpriced, or underpriced.
Outcome
Users can adjust the proposed price and instantly re-run the assessment, turning the model from a one-time prediction into an iterative pricing decision-support tool. The system surfaces where a price sits relative to the market and what that implies for negotiation or walk-away decisions.
Vehicle details → Pricing model → Expected market price → Proposed price → Z-score benchmarking → Risk classification → Plain-language assessment → Recommendation → Price adjustment → Re-evaluation
Skills Shortage & Labour Market Analysis
Problem
Are 485 graduate inflows helping ease Australia's labour-market pressure, and does the relationship vary across occupation groups?
What I Built
Analysed IVI job-ad, ABS labour-force, and 485 Graduate Visa data across occupations and states from 2020 to 2025. Used Python to clean and standardise the data, then built an interactive Tableau analytical story comparing graduate inflows with labour-market pressure by occupation.
Outcome
2022 was the peak pressure year, followed by a broad easing in labour-market pressure. Professionals and Managers showed clearer cooling alongside increasing graduate inflows, while other ANZSCO groups showed uneven alignment, indicating no consistent directional relationship between graduate inflows and labour-market pressure across occupations. The analysis highlights where graduate supply appears more aligned with easing pressure and where shortages remain less responsive.
Technical Skills
Data & BI
- SQL
- PostgreSQL
- Tableau
- Power BI
- Streamlit
- Metabase
- Excel
Data Engineering
- Python
- ETL / ELT
- Incremental Loading
- Data Modeling
- Data Mart Development
- Apache Airflow
- REST API Integration
- Data Quality & Reconciliation
- Git / GitHub
- Jira / Confluence
Analytics
- KPI Analysis
- Pareto Analysis
- Cohort Analysis
- Segmentation
- Hypothesis Testing
Master of Information Systems
Master of Information Systems
Major in Data Analytics
Australian Institute of Higher Education, Sydney / Graduated July 2026
Get in touch
Open to Data Analyst, BI Analyst, BI Developer, and Analytics Engineer roles in Sydney. I am looking for teams where the work is hands-on, the output is used by real stakeholders, and there is room to grow.